The story
Trucks crossing from Mexico into the United States were down 4.0% in September 2026 from a year earlier, and flat for the year to date, while the dollar value of U.S.-Mexico trade is up more than 25%. Southbound, the two largest public counts (Laredo and El Paso's Ysleta bridge) are each up about 3.5% for July through September, and most of the smaller Texas bridges are down. This page uses public sources only and is updated monthly. Data through September 2026 for truck counts and August 2026 for trade value. Last updated October 27, 2026.
How many trucks crossed the U.S.-Mexico border last month?
610,376 trucks entered the United States from Mexico in September 2026, according to the Bureau of Transportation Statistics (BTS) Border Crossing Entry Data, which republishes U.S. Customs and Border Protection counts. That is 4.0% below September 2025 (635,915). The third quarter (July through September) was down 1.6%, and January through September was flat at 5.73 million, within 0.1% of the same months in 2025.
These counts are northbound only, include empty trailers, and count crossings rather than unique trucks. BTS says CBP does not collect comparable data on outbound (southbound) crossings.
Which ports are growing and which are shrinking?
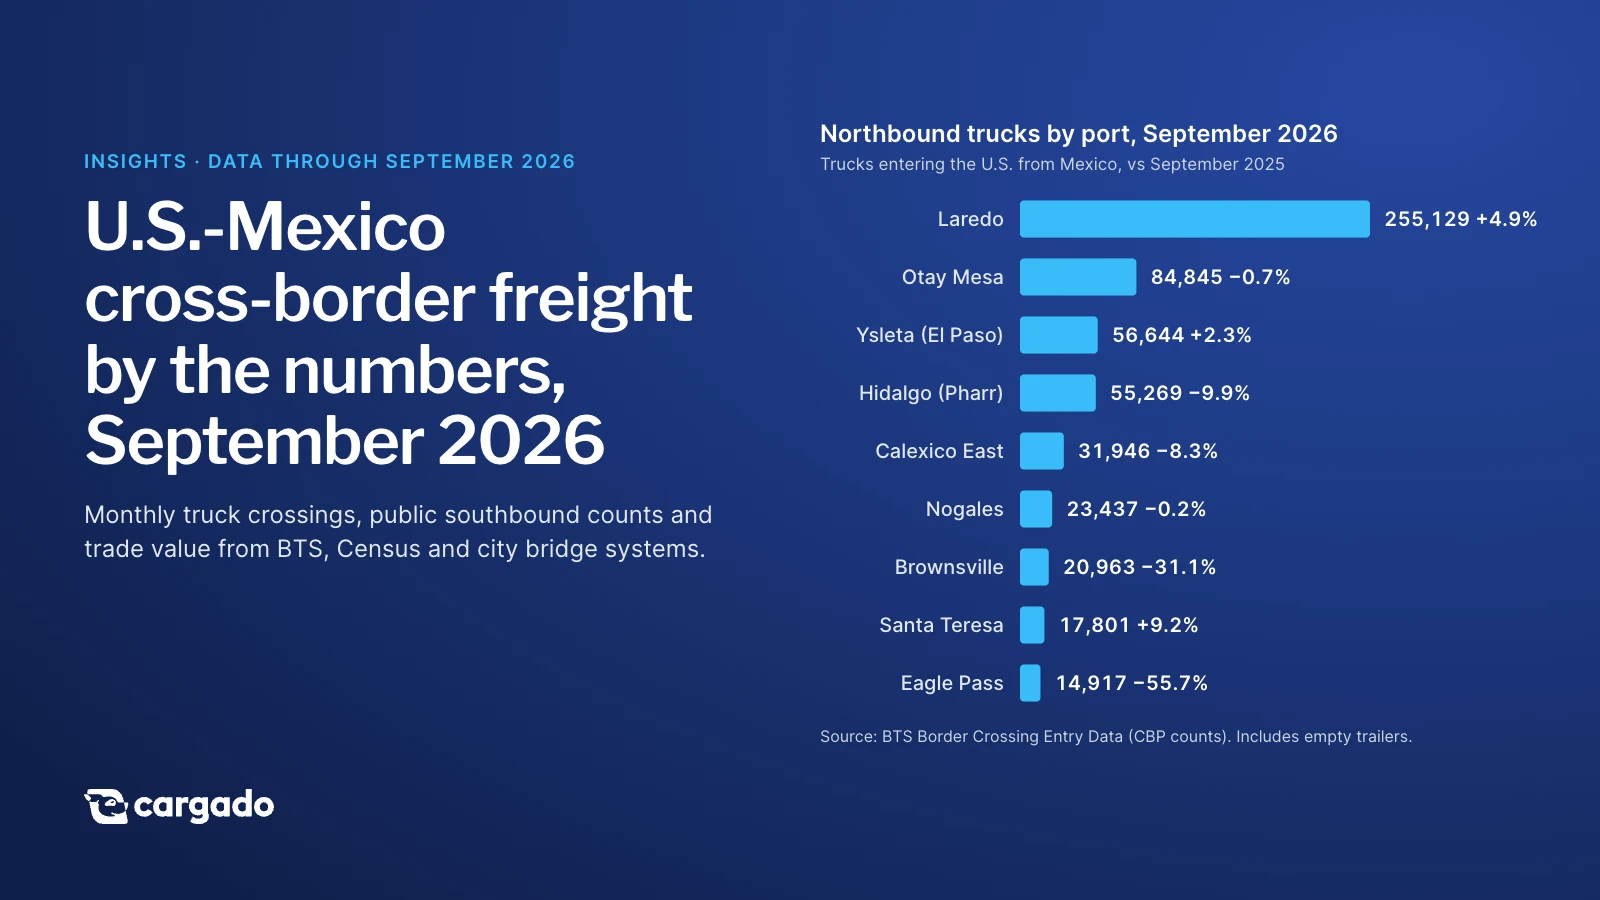
Laredo handled 255,129 northbound trucks in September 2026, up 4.9% from a year earlier and about 42% of the border total (BTS). Santa Teresa, New Mexico was up 9.2% to 17,801 and El Paso's Ysleta bridge was up 2.3% to 56,644. Almost every other port fell: Otay Mesa down 0.7% (84,845), Nogales down 0.2% (23,437), Calexico East down 8.3% (31,946), Hidalgo (which includes the Pharr bridge) down 9.9% (55,269), Brownsville down 31.1% (20,963), and Eagle Pass down 55.7% (14,917). All figures are BTS, September 2026 versus September 2025.
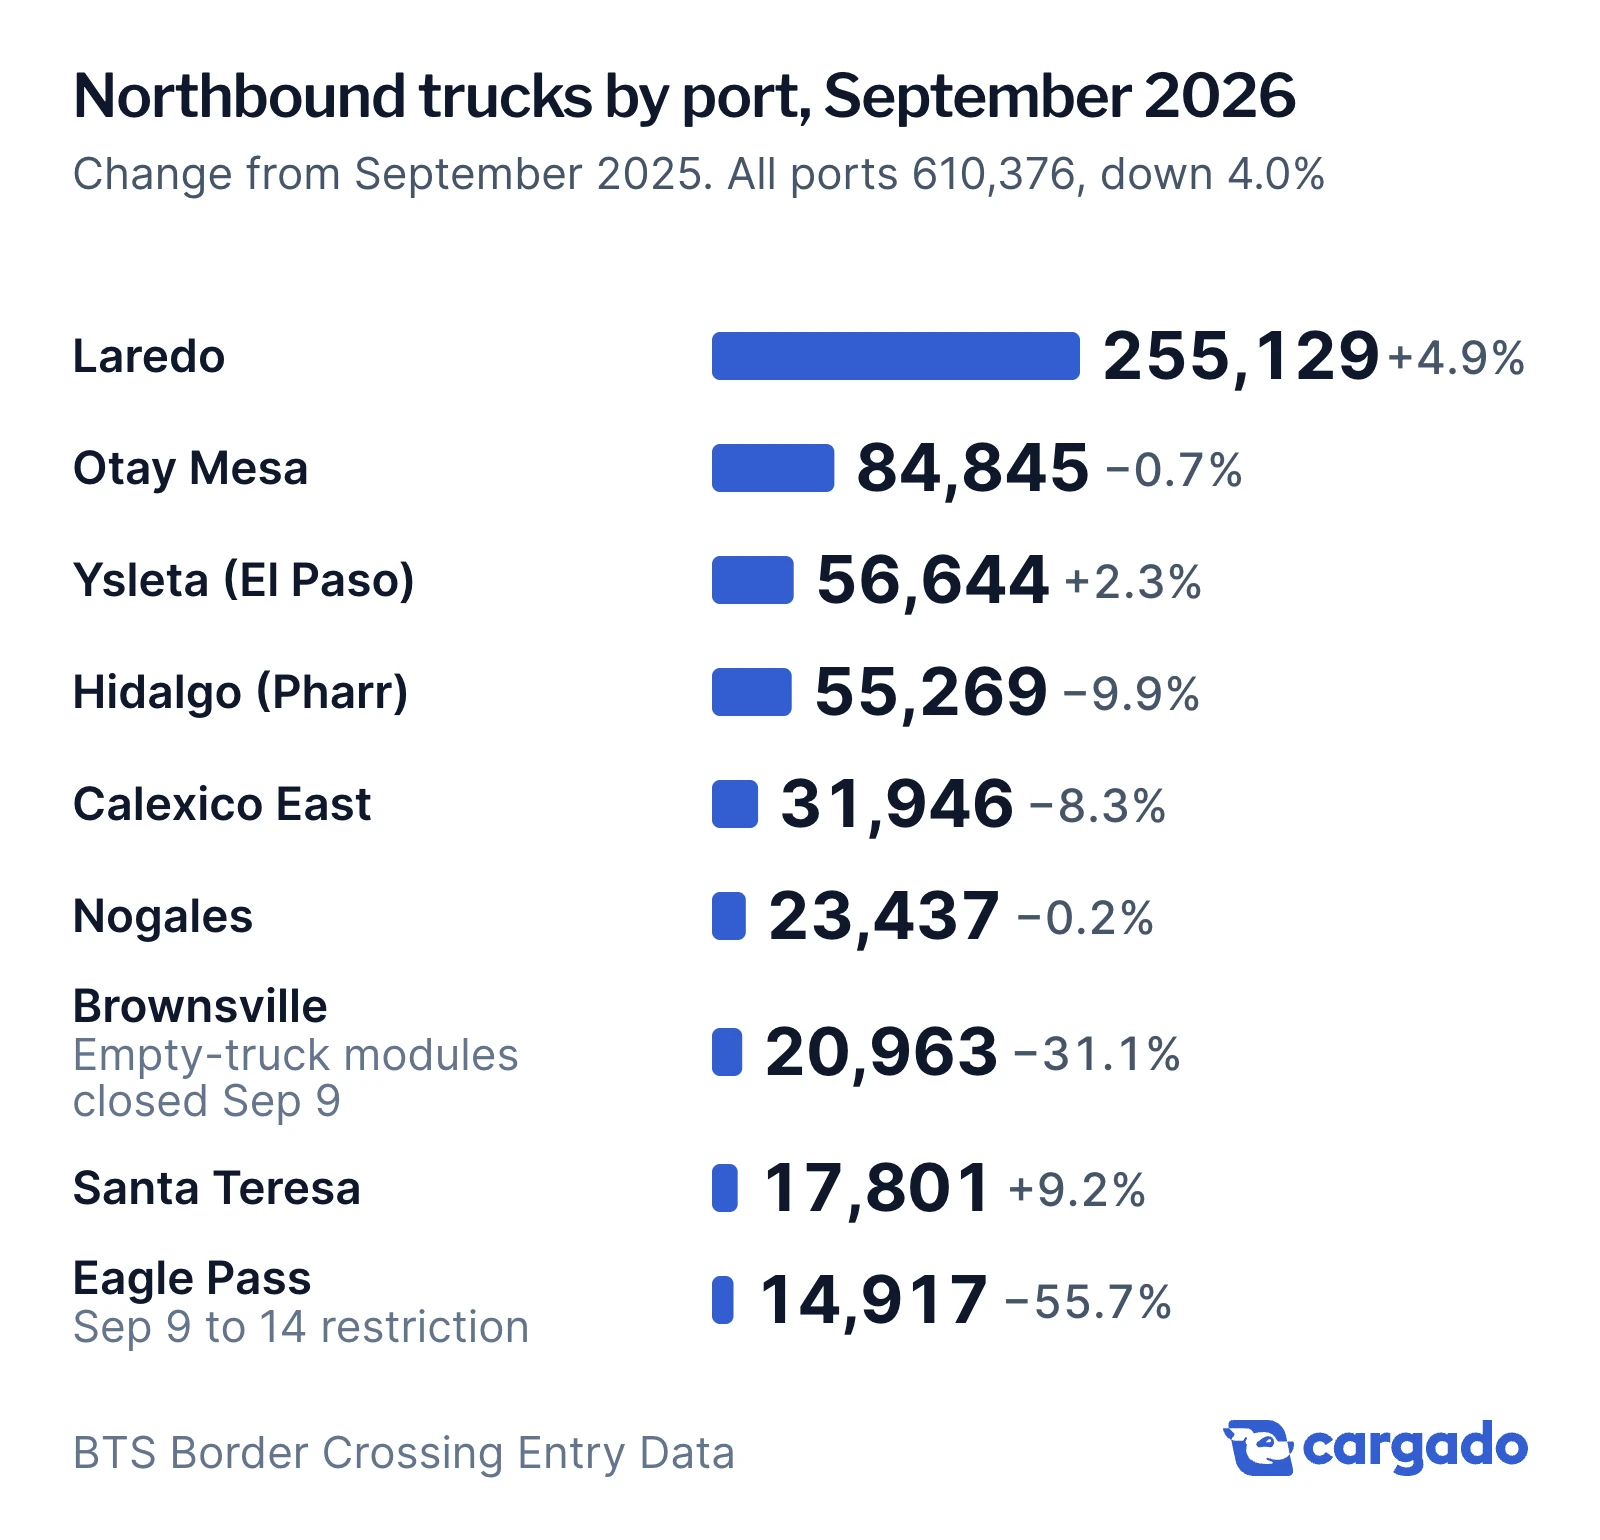
Eagle Pass and Brownsville carry a specific story. From September 9 to 14, 2026, Mexican customs barred empty tractors heading south at Piedras Negras, across from Eagle Pass, and Eagle Pass bridge director Patricia Mancha told the city council that commercial traffic fell from about 1,000 trucks a day to 300 to 400 (FreightWaves, September 17, 2026). A Mexican customs circular also closed the empty-truck import modules at the Zaragoza (Los Tomates) bridge opposite Brownsville from September 9, as reported by Excelsior.
How many trucks go south into Mexico?
Nobody publishes a border-wide southbound truck count. CBP counts inbound trucks only. Southbound trucks get counted where a U.S. bridge owner collects a southbound toll, and a few of those owners publish the numbers:
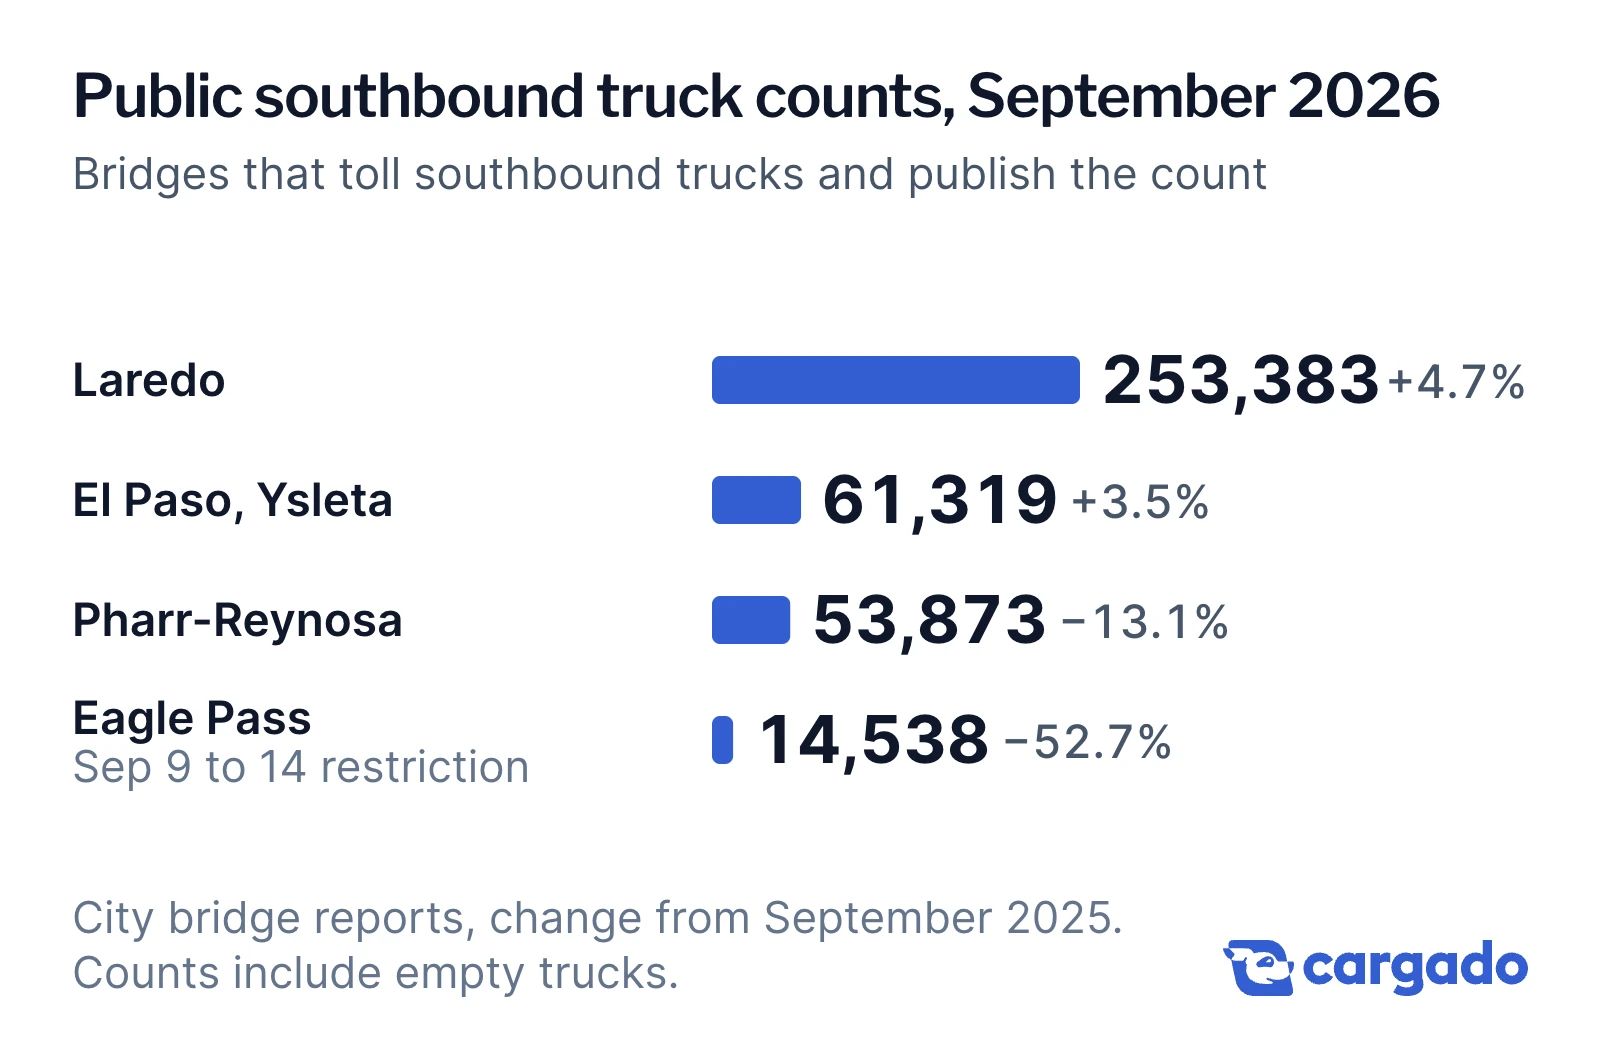
- Laredo: 253,383 southbound trucks in September 2026, up 4.7% from September 2025 (City of Laredo International Bridge System, as compiled by the Laredo Economic Development Corporation). July through September was up 3.6%, and January through September was up 1.7%.
- El Paso, Ysleta-Zaragoza bridge: 61,319 southbound cargo trucks in September 2026, up 3.5%, counted at the Mexico-bound toll lanes (City of El Paso International Bridges Department). July through September was also up 3.5%.
- Pharr-Reynosa: 53,873 southbound trucks in September 2026, down 13.1% (City of Pharr bridge statistics). August was 53,606, down 10.6%.
- Eagle Pass: 14,538 commercial vehicles in September 2026, down 52.7% from 30,723 (City of Eagle Pass monthly traffic report). The city's report does not label direction; the city's August 2026 figure (24,442) matches the Pharr bridge board's southbound count for Eagle Pass that month.
The widest public view comes from the City of Pharr's bridge board packet, which each month lists southbound truck counts for ten other Texas toll bridges beside Pharr's own. For August 2026, the eleven bridges together moved about 440,900 southbound trucks, about 1.9% fewer than in August 2025. Laredo (258,505) and Ysleta (61,263) were up 3% each. The other nine bridges combined were down about 12%: Pharr down 11%, Eagle Pass down 25%, Veterans/Los Tomates at Brownsville down 22%, Progreso down 9%, Anzalduas (empty trucks only) down 14%, while Los Indios (up 56%), Del Rio (up 16%) and Roma (up 41%) grew from small bases. The Pharr packet's Laredo count runs about 1% above the Laredo EDC series because of a scope difference, so use it for direction, not level.
Is cross-border trade growing in dollars?
Yes, and much faster than the truck counts. The U.S. Census Bureau reports goods imports from Mexico of $60.6 billion in August 2026, up 34.2% from August 2025, and exports to Mexico of $33.7 billion, up 15.3% (all modes, Census basis, not seasonally adjusted). January through August imports were up 18.3% and exports up 16.6%.
BTS TransBorder Freight Data, released October 21, 2026, puts U.S.-Mexico freight at $94.3 billion in August 2026, up 26.7%. Trucks carried $73.9 billion of that. Across both borders, trucks moved $109.0 billion, up 29.8%, the fastest-growing mode. Laredo was the top port by value at about $37.7 billion across all modes, and Laredo, El Paso and Otay Mesa were the top truck ports with Mexico. The top commodity across both borders was computer-related machinery and parts at $40.9 billion.
The gap between flat truck counts and rising dollars comes from mix. Higher-value freight is moving in about the same number of trucks.
The numbers in one table
| Series | Direction | Latest | Value | Year over year | Source |
|---|---|---|---|---|---|
| Incoming trucks, all U.S.-Mexico ports | Northbound | Sep 2026 | 610,376 | -4.0% (Jul-Sep -1.6%; Jan-Sep 0.0%) | BTS Border Crossing Entry Data |
| Incoming trucks, Laredo | Northbound | Sep 2026 | 255,129 | +4.9% | BTS Border Crossing Entry Data |
| Southbound trucks, Laredo | Southbound | Sep 2026 | 253,383 | +4.7% (Jul-Sep +3.6%; Jan-Sep +1.7%) | City of Laredo bridge system via Laredo EDC |
| Southbound cargo trucks, El Paso Ysleta-Zaragoza | Southbound | Sep 2026 | 61,319 | +3.5% (Jul-Sep +3.5%) | City of El Paso International Bridges Department |
| Southbound trucks, Pharr-Reynosa | Southbound | Sep 2026 | 53,873 | -13.1% | City of Pharr bridge statistics |
| Commercial vehicles, Eagle Pass | Southbound (per press and Pharr board slide) | Sep 2026 | 14,538 | -52.7% | City of Eagle Pass monthly traffic report |
| Southbound trucks, 11 Texas toll bridges | Southbound | Aug 2026 | about 440,900 | about -1.9% | City of Pharr bridge board packet (Sep 2026 meeting) |
| Goods imports from Mexico, all modes | Northbound value | Aug 2026 | $60.6B | +34.2% | U.S. Census Bureau |
| Goods exports to Mexico, all modes | Southbound value | Aug 2026 | $33.7B | +15.3% | U.S. Census Bureau |
| U.S.-Mexico freight, all modes | Both | Aug 2026 | $94.3B | +26.7% | BTS TransBorder Freight Data |
| Truck freight, U.S.-Mexico | Both | Aug 2026 | $73.9B | not published in release | BTS TransBorder Freight Data |
Source: Cargado analysis of BTS Border Crossing Entry Data, BTS TransBorder Freight Data, U.S. Census Bureau, City of Laredo International Bridge System (via Laredo EDC), City of El Paso International Bridges Department, City of Pharr bridge statistics and board packets, and City of Eagle Pass monthly traffic reports.
How to read these numbers
- Value is not volume. TransBorder and Census dollars are current dollars, not adjusted for inflation, and move with prices and commodity mix. Truck counts and shipping weight are the physical measures.
- Single months are noisy. Weekday and holiday counts swing a month's truck total by several points. Trailing three-month and year-to-date changes are steadier.
- The 2025 base may be estimated. BTS said its August 2025 TransBorder figures were estimated from historical averages because of a data gap, so dollar comparisons against late 2025 may be revised.
- Southbound counts are partial. They exist only where a U.S. bridge owner tolls southbound traffic (Laredo, El Paso, Pharr and the other Texas toll bridges in the Pharr packet). No Arizona or California port publishes one, and the counts include empty trucks.
- Mexico still publishes. A common claim is that Mexico stopped publishing freight data. INEGI's monthly merchandise trade balance, ANAM's customs operations reports and the SICT bulletins all continue.
Truck counts for a month post about four weeks after month end; BTS TransBorder releases run about eight weeks; Census trade about five weeks. The October 2026 truck counts should post in late November.
What it means for brokers, shippers and carriers
For brokers and shippers, the physical market is flat to slightly down this year and the growth is concentrated at Laredo, Ysleta and Santa Teresa, so capacity planning and rate benchmarks should be built by crossing, not for the border as a whole. For carriers, Laredo keeps gaining share in both directions, while the Eagle Pass and Brownsville drops are tied to Mexico's September restriction on empty southbound trucks and may reverse. Crossing-by-crossing detail is on the border crossings hub, and the northbound and southbound glossary entry explains the direction terms used here.
Cargado is the marketplace for Mexico and Canada freight: brokers post loads and get market rates, carriers find cross-border loads, and shippers get rates for their lanes at cargado.com.
Sources
- BTS Border Crossing Entry Data (Socrata API, measure=Trucks, border=US-Mexico Border), data through September 2026
- BTS press release: North American Transborder Freight valued at $160.6 billion in August 2026, up 22.6% (Oct 21, 2026)
- AJOT reprint of the BTS August 2026 TransBorder release (used to read the release text; bts.gov blocks automated fetches)
- BTS Monthly Transportation Statistics table (TransBorder U.S.-Mexico freight, all modes, through Aug 2026)
- BTS press release noting the August 2025 TransBorder figures were estimated
- U.S. Census Bureau, U.S. trade in goods with Mexico (c2010)
- Laredo EDC economic indicators: 2016-2026 Southbound Trucks Laredo POE (source: City of Laredo International Bridge System)
- City of El Paso International Bridges Department, cargo truck crossings (Cargo.xlsx, Cargo SB worksheet), via PDN Uno
- City of Pharr bridge statistics, crossings and revenues monthly comparison (September FY 2025-2026)
- City of Pharr Bridge Board agenda packet, Southbound Truck Crossings Comparison slide, August 2026 (CivicClerk fileId 9599)
- City of Eagle Pass, Monthly Traffic Report, September 2026
- Excelsior, ANAM circular closing empty-truck import modules at Puente Zaragoza (Sep 9, 2026)
- INEGI, Balanza comercial de mercancias de Mexico (monthly)
- ANAM, Agencia Nacional de Aduanas de Mexico
- SICT, Secretaria de Infraestructura, Comunicaciones y Transportes
- FreightWaves: Mexico lifts empty-truck restriction after 700 tractors stranded at border (Sep 17, 2026)