
Look up rates for a spreadsheet of lanes
Upload any spreadsheet of lanes to Cargado Market Rates. AI maps the columns, flags what it cannot read, and prices each lane it can match. Export to CSV.
https://cdn.prod.website-files.com/68f656dee991ae15a5cbb747/6ae9d1795d41b520aed48a24_BulkLookups-howto-light-v1.5-1080p.mp4
https://cdn.prod.website-files.com/68f656dee991ae15a5cbb747/6ae9d17a0aea895339edb7f4_BulkLookups-howto-light-v1.5-poster.jpg
https://cdn.prod.website-files.com/68f656dee991ae15a5cbb747/6ae9d17b5b5bb8fd232d0bb3_BulkLookups-howto-light-v1.5.en.vtt
You can price a whole spreadsheet of lanes at once, right in the Cargado app. Upload the sheet the way you received it. Cargado reads the columns, finds the origin, destination and trailer type on each row, and returns a market rate for each lane it can match.
What you get
- Low, median and high
- A market rate range for each lane Cargado can match, with a confidence label.
- Export CSV
- The same rates in a file, ready for your RFP response or pricing sheet.
- 12-week history
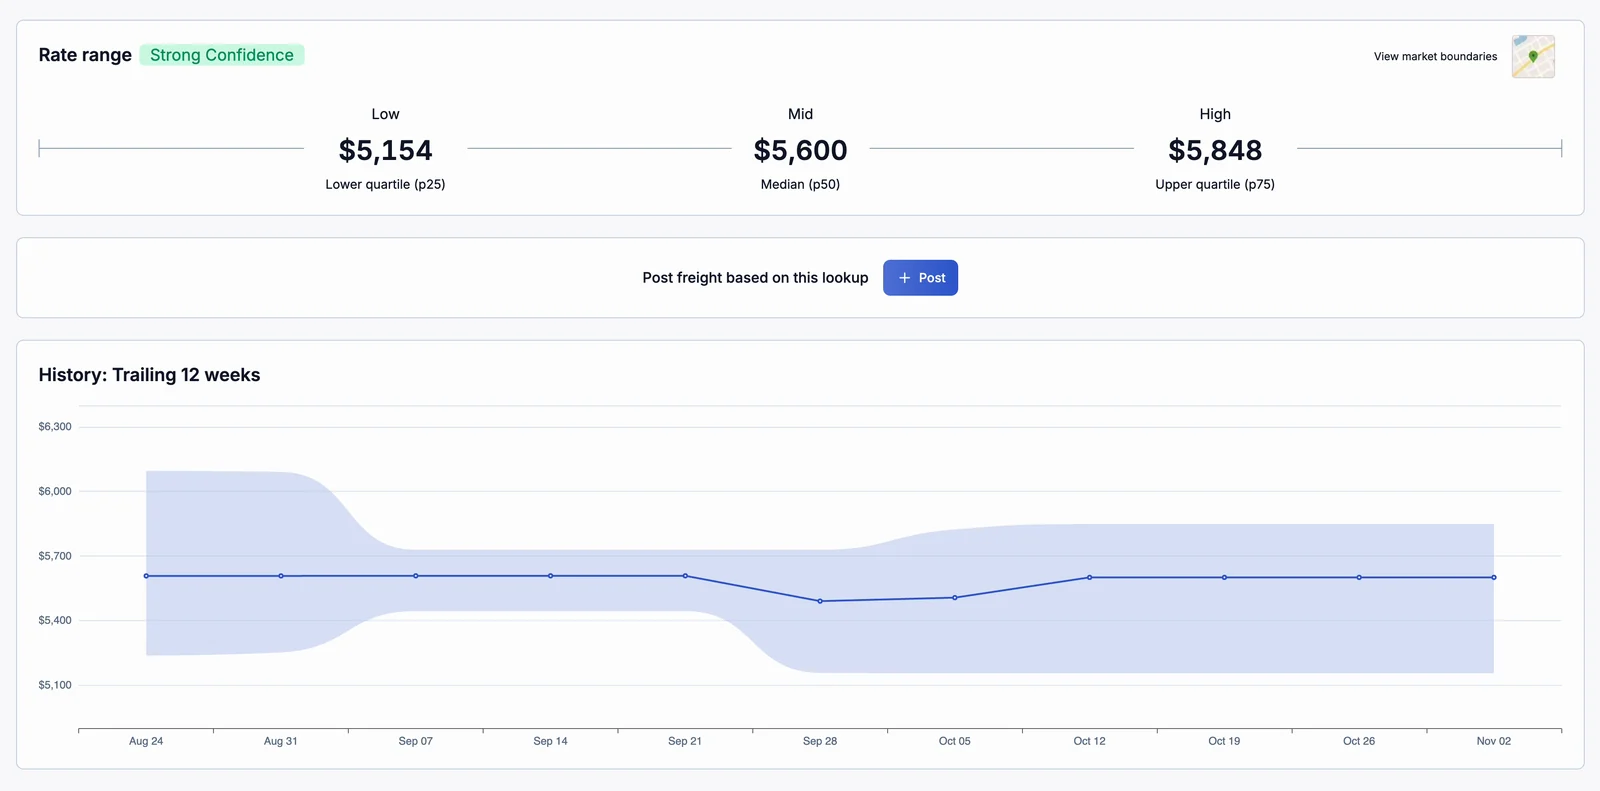
- Open a lane to see how its rates moved over the last 12 weeks.
There are two ways to price a list of lanes. Upload a spreadsheet in the app: nothing to install, and this article covers it. Or use the Excel add-in if you work inside Excel: see Install and use the Excel add-in.
Bulk lookups are available to every Market Rates user on a broker account.
Before you start
- Any spreadsheet works: .xlsx, .xls or .csv, up to 10 MB, with one tab or several. There is no template to fill out.
- One lane per row: each row should have an origin and a destination. A trailer type column helps; a border crossing column is used if you have one.
- Headers and extra columns: column headers can be in English or Spanish. Extra columns are fine. Cargado ignores what it does not need.
Step 1: Open the upload page
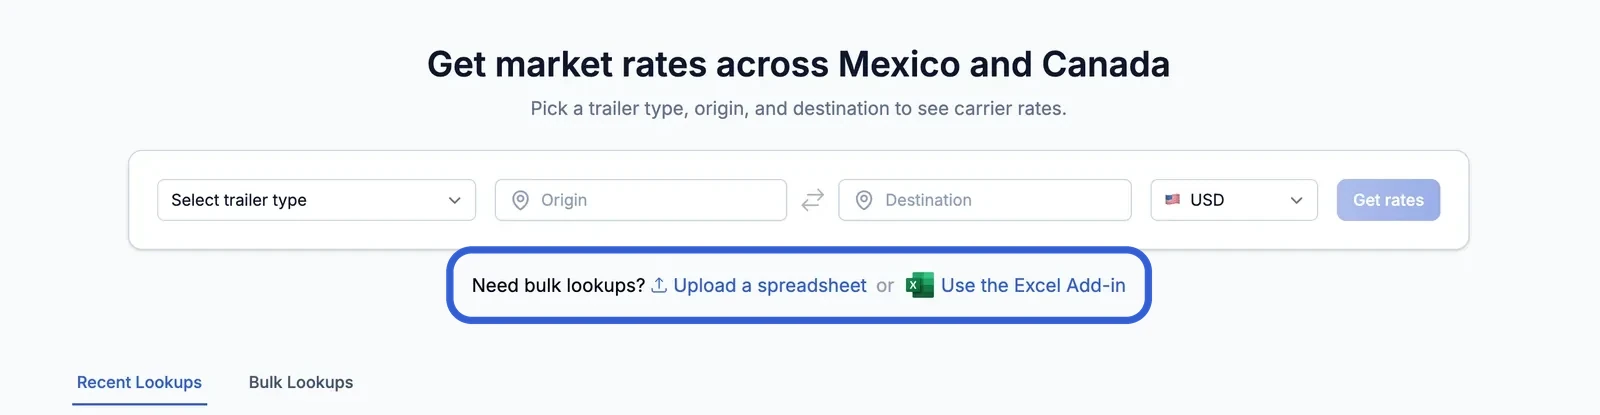
Go to Market Rates in the Cargado app. Under the lookup box, find the line Need bulk lookups? Upload a spreadsheet or Use the Excel Add-in. Click Upload a spreadsheet. You can also go straight to the upload page: app.cargado.com/rates/bulk-upload.
Step 2: Upload your file
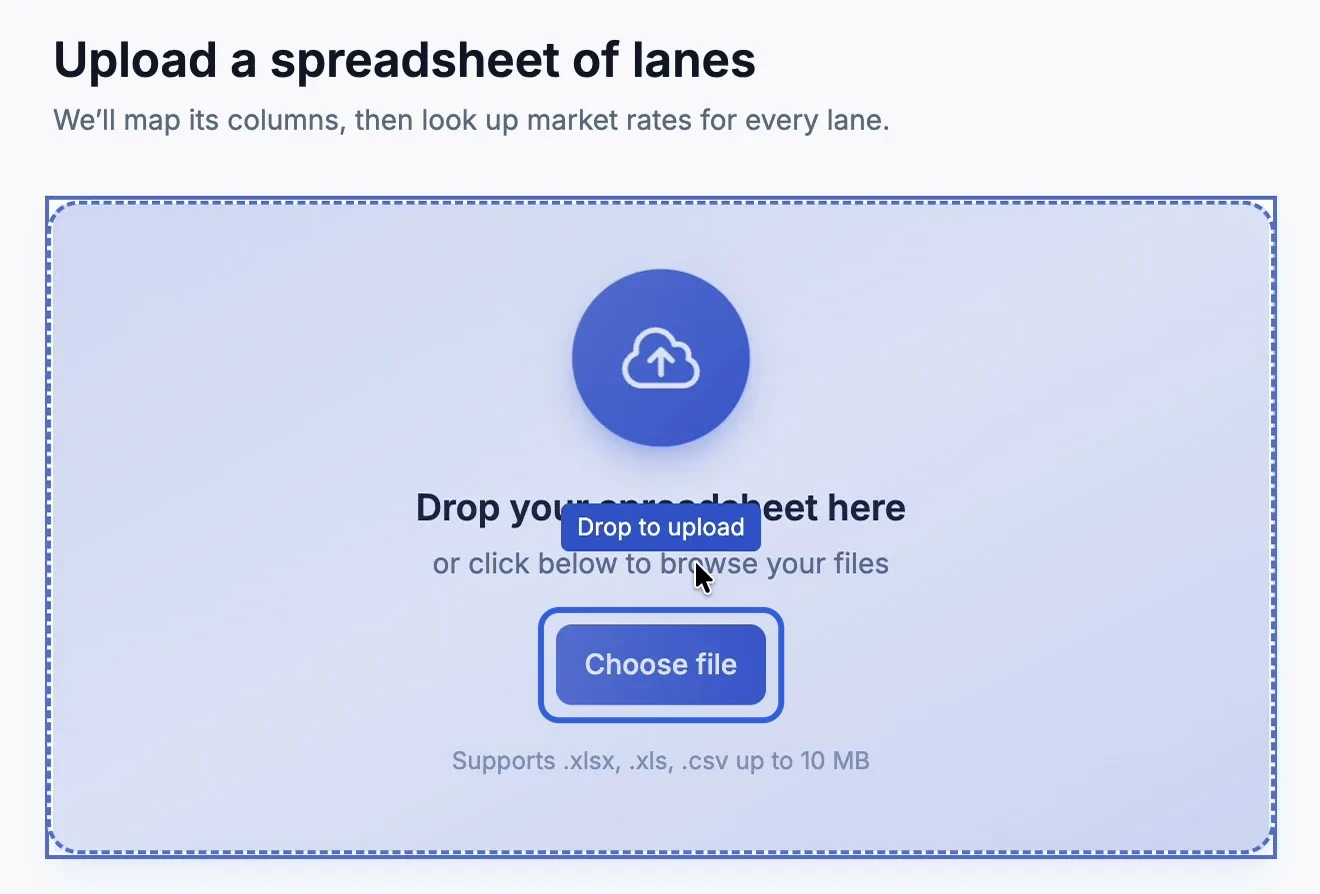
Drop your file onto the page, or click Choose file to pick it from your computer. The page accepts .xlsx, .xls and .csv files up to 10 MB.
Step 3: Let Cargado read the sheet
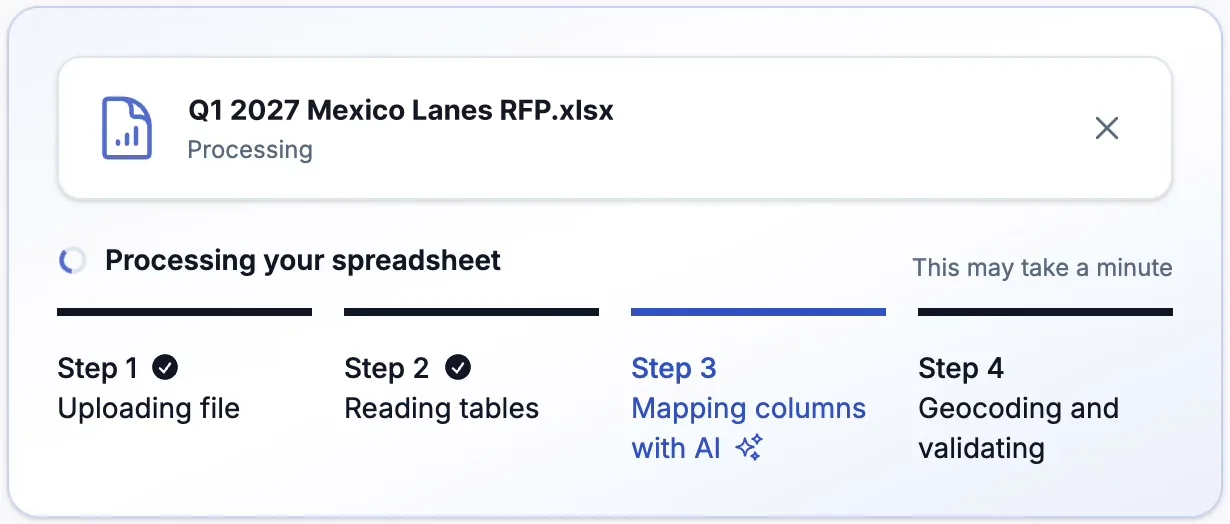
Processing runs in four steps you can watch: Uploading file, Reading tables, Mapping columns with AI and Geocoding and validating. Every tab in the workbook is detected. The AI reads whatever columns the sheet has and maps them to origin, destination, trailer type and, if your sheet has one, border crossing. This may take a minute.
Step 4: Check what was found
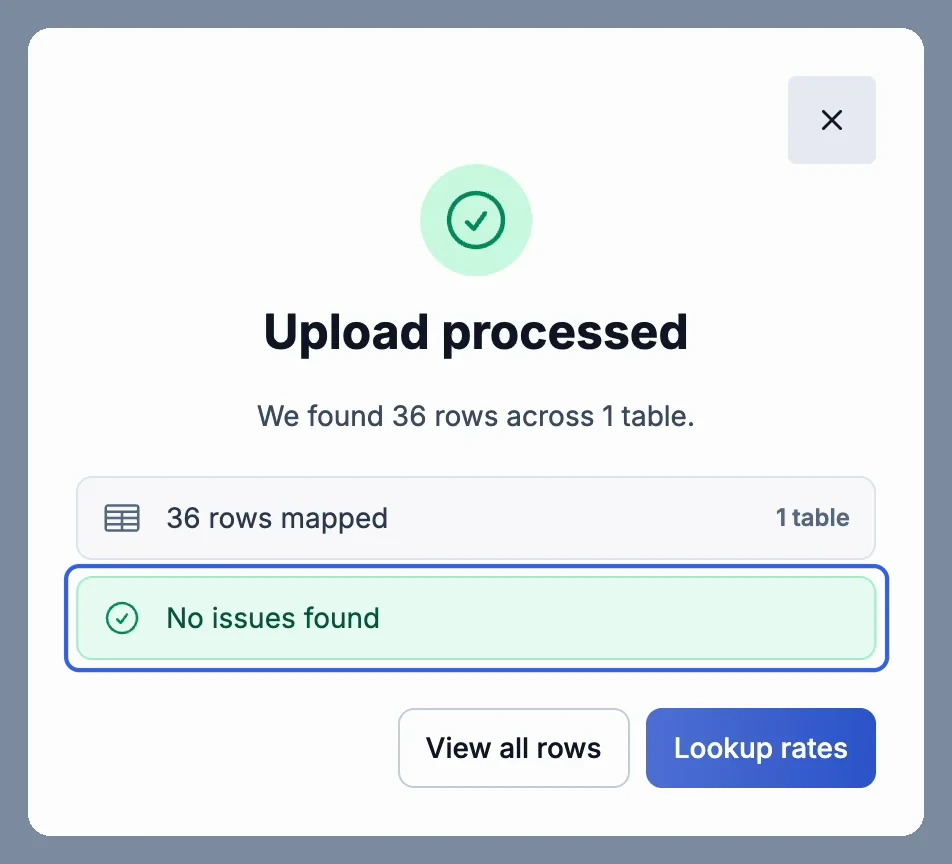
When processing finishes, the Upload processed dialog says how many rows it found and across how many tables, how many rows were mapped, and whether any issues need your attention. If it says No issues found, click View all rows to check the mapping (step 6), or Lookup rates to go straight to the lookup (step 7). If it lists issues, click Resolve issues now to fix them first.
Step 5: Fix anything it could not read
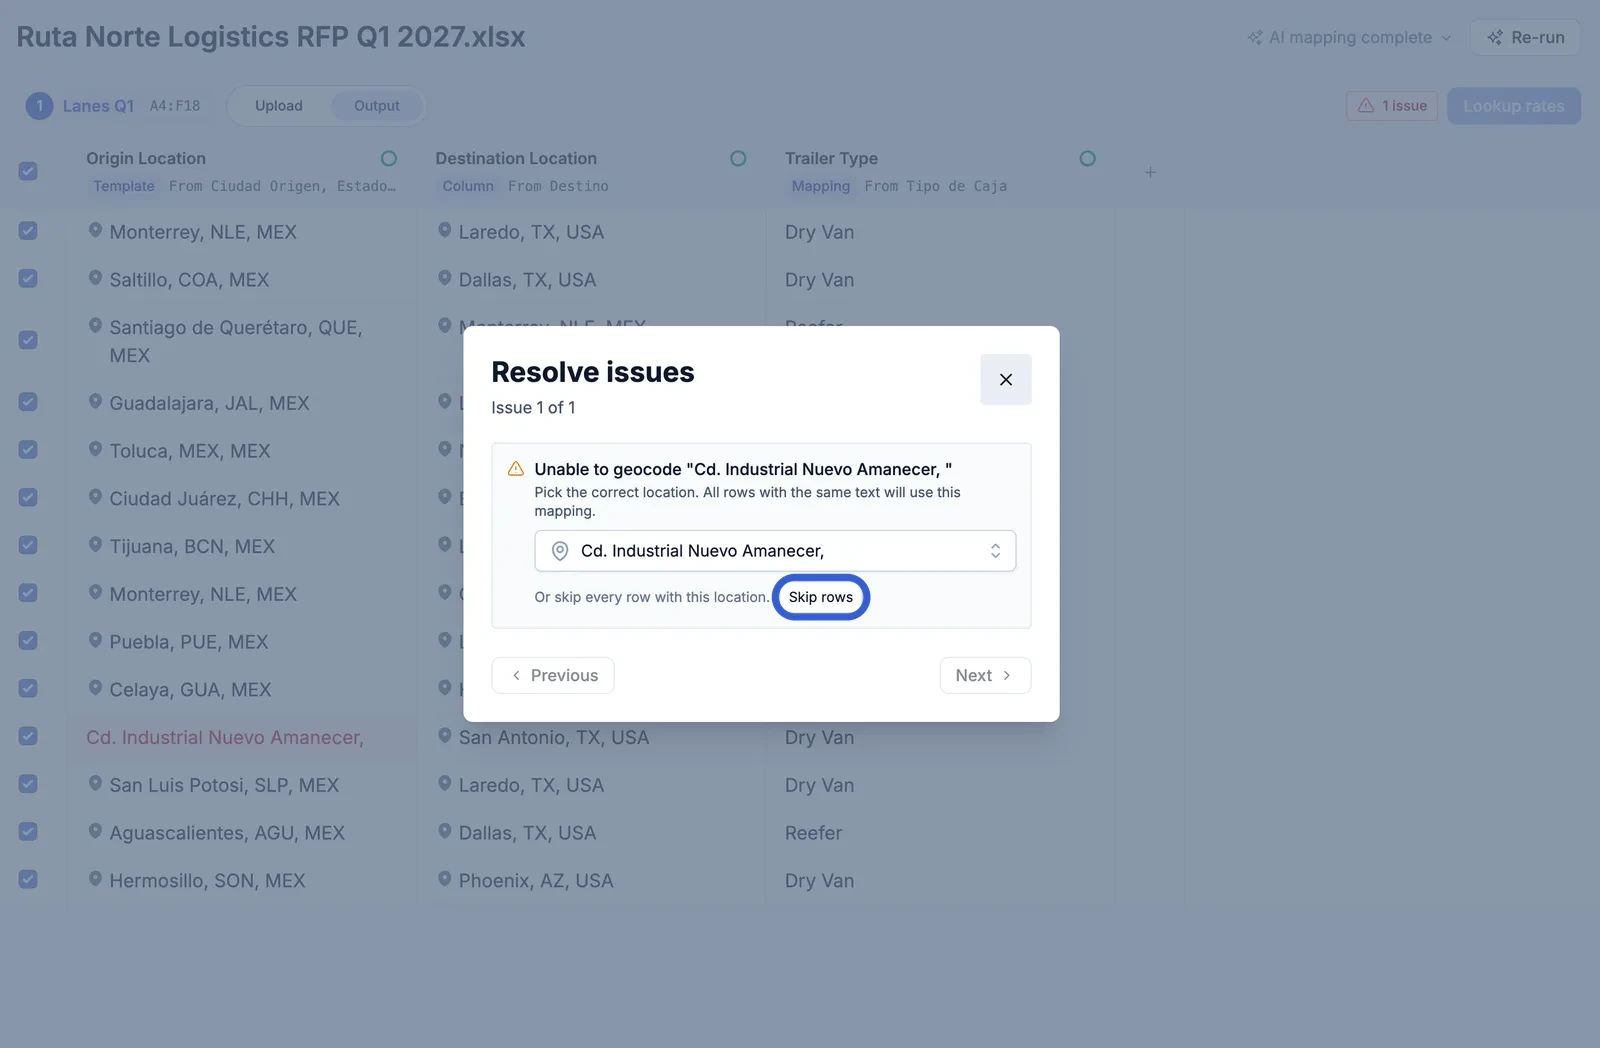
If a location could not be found, the Resolve issues dialog shows it, one issue at a time. You have two choices:
- Pick the correct place. Choose it from the suggestions. Every row with the same text uses the place you pick, so you fix a repeated entry once, and the rows stay in the batch.
- Skip rows. Click Skip rows beside Or skip every row with this location to leave those rows out of the batch.
Step 6: Review the mapping
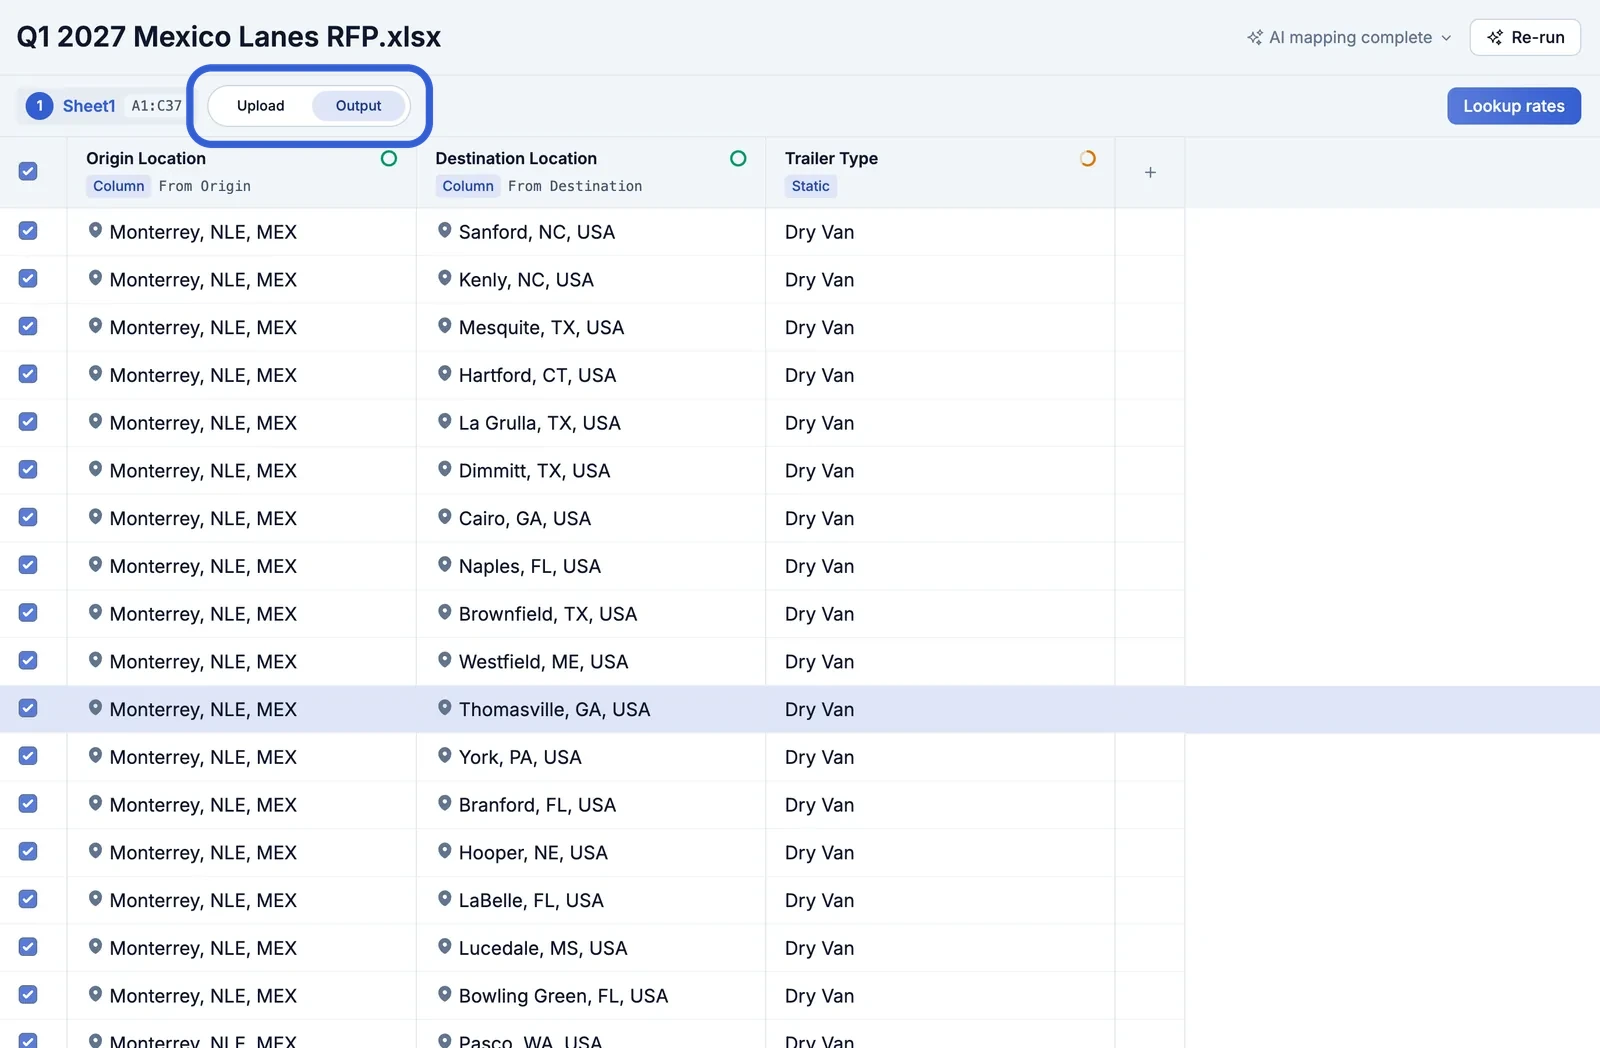
The review screen shows the mapped output, with a toggle to see your original upload next to it, so you can check how each column was read.
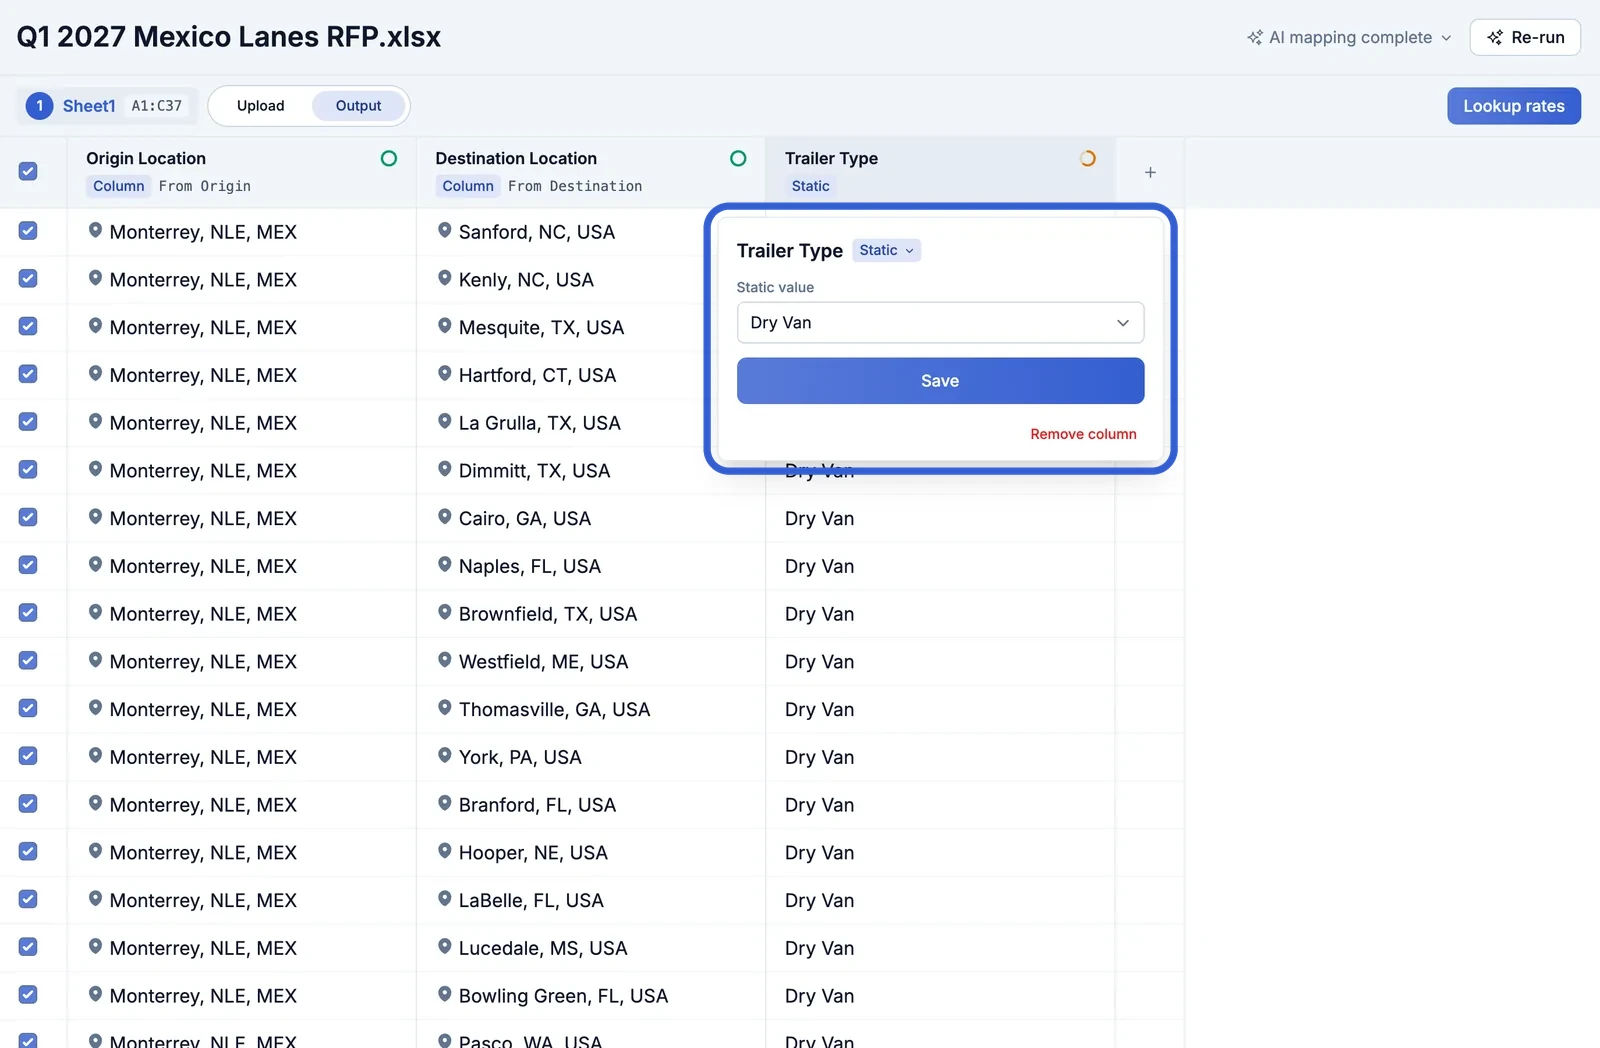
- To change a column, click it and choose how it should be read. A column can come from your sheet or be set to one value for every row, such as Dry Van.
- To add a column, use the + at the end of the header row. To remove one, open it and click Remove column.
- To let the AI try again after your changes, click Re-run.
Step 7: Run the lookup
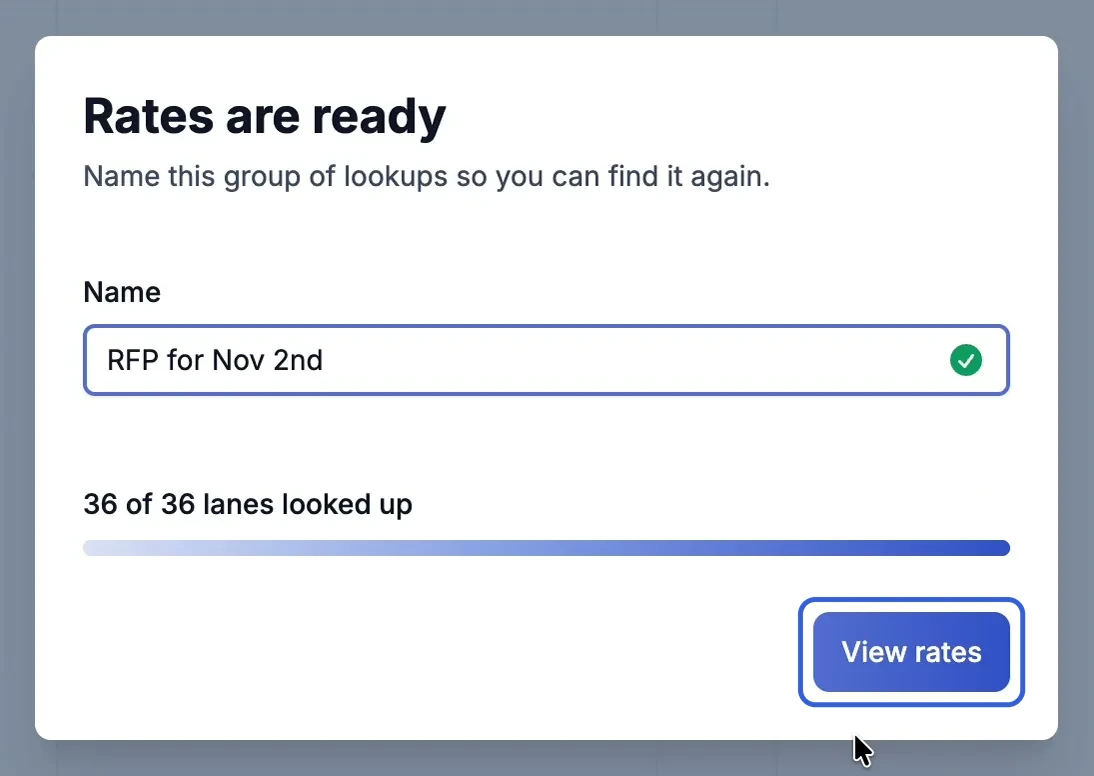
Click Lookup rates. A Looking up rates dialog shows the batch working through your lanes. It asks you to name the group of lookups so you can find it again, and starts with the file name. When the batch finishes, the dialog says Rates are ready and shows how many lanes came back without rates. Click View rates.
Step 8: Read and export the results
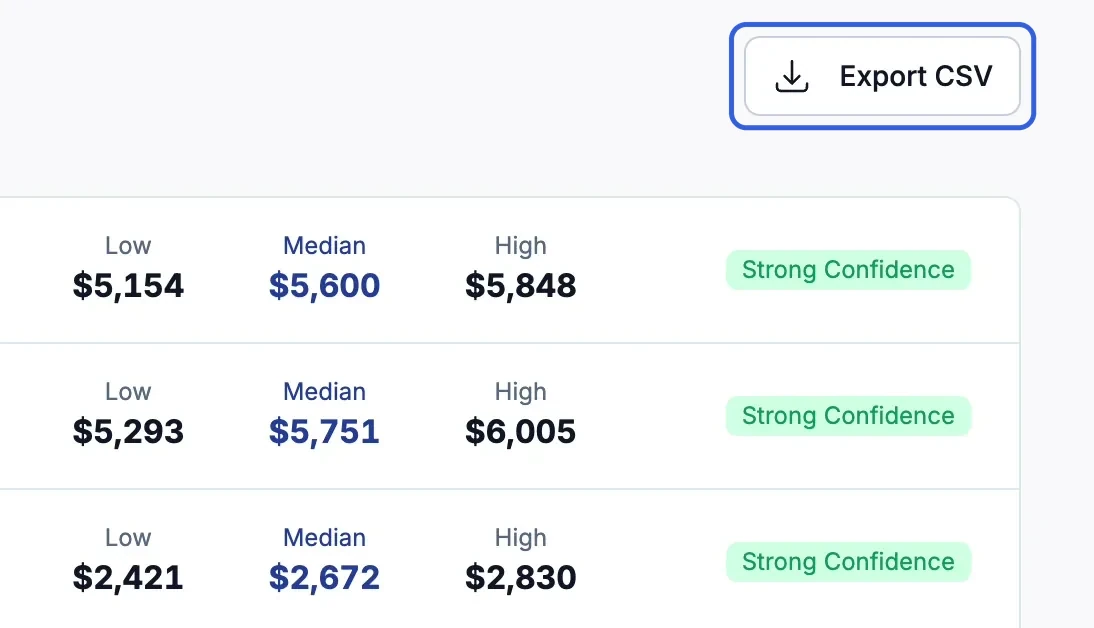
The results page shows a Low, Median and High market rate for each priced lane, with a confidence label, the distance and the trailer type. Each lane shows two lines: the bold line is the market Cargado priced, and the gray line under it is the place as written in your sheet. Click the pencil beside the batch name to rename it. Click Export CSV to download the whole batch. The file has the same Low, Median and High rates, in dollars, that you see on screen, ready to paste into your RFP response or pricing sheet. Open a lane to see its rate range and its rates over the last 12 weeks.
Tip: Some lanes can come back without a rate. The count is shown in the Rates are ready dialog and on the Bulk Lookups tab.
Find a batch later
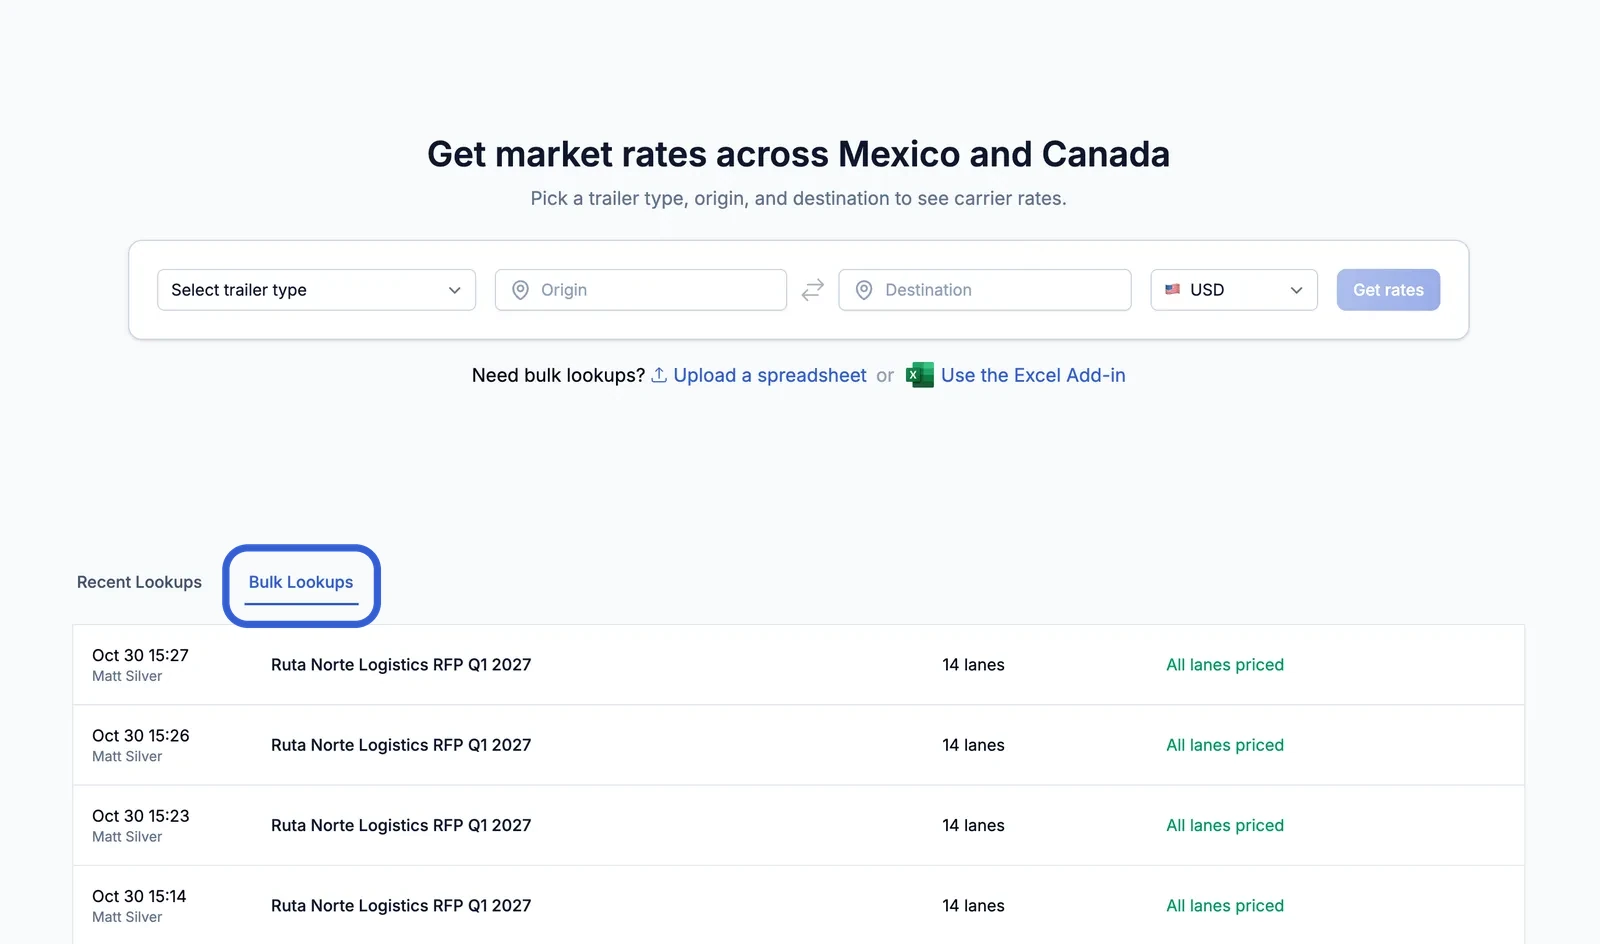
Every batch your team runs is saved under the Bulk Lookups tab, next to Recent Lookups on the Market Rates page. Open a batch to read it again or export it.
Good to know
- A location could not be found: open Resolve issues now from the Upload processed dialog and pick the correct place, or click Skip rows to leave out every row with that location. City names work best when the sheet also has a state or country column. If the sheet only has a plant name or a postal code, pick the matching city when prompted.
- A town landed in the wrong place. Small towns that share a name with a bigger place (for example Hartford, MI and Hartford, CT) can be matched to the wrong one without an issue being raised. Before you click Lookup rates, scan the mapped origin and destination columns on the review screen and fix any location that looks off.
- A column was mapped to the wrong field: on the review screen, click the column and fix it. If several columns look alike, such as a pickup city and a consignee city, check that origin and destination point at the ones you mean.
- The mapping is off in several places: fix the one or two columns you can identify, then click Re-run so the AI remaps the rest with your corrections in place.
- My sheet has several tabs: every tab is detected. Check the across N tables count in the Upload processed dialog against what you expected.
- What counts toward usage: each lane in a batch is a normal Market Rates lookup and counts toward your account's usage, the same as a single lookup in the app or the Excel add-in. A lane you already priced this period is not counted twice. To see your usage, read Plan limits, and what the usage warning emails mean.
- Who can use it: every Market Rates user on a broker account. Carrier accounts can use it only if rates are turned on for their organization.
Still stuck?
Email us and a person on our team will answer. Send the posting link or a screenshot if you have one.