
How to read a market rate
What Low, Mid, High and Confidence mean on a Cargado market rate, plus the 12-week chart, extended markets and currency.
In 4 steps
A market rate on Cargado is a band, not a single rate-card number. A successful lookup shows three numbers and, when one is available, a confidence label. Knowing what stands behind each one tells you how far to trust it.
Each lookup is priced by trailer category, between the market your origin sits in and the market your destination sits in. Depending on how your organization is set up, a lookup runs on live market data or on simulated data.
Step 1: Read Low, Mid and High
The Rate range card shows the latest period returned:
- Low: the 25th percentile (p25). A quarter of the data behind the lookup sits at or below it.
- Mid: the median (p50). Half sits above it, half below.
- High: the 75th percentile (p75). A quarter sits at or above it.
The app shows a fuel-inclusive total per load. See Does the market rate include fuel? The API also returns per-mile figures when they are available.
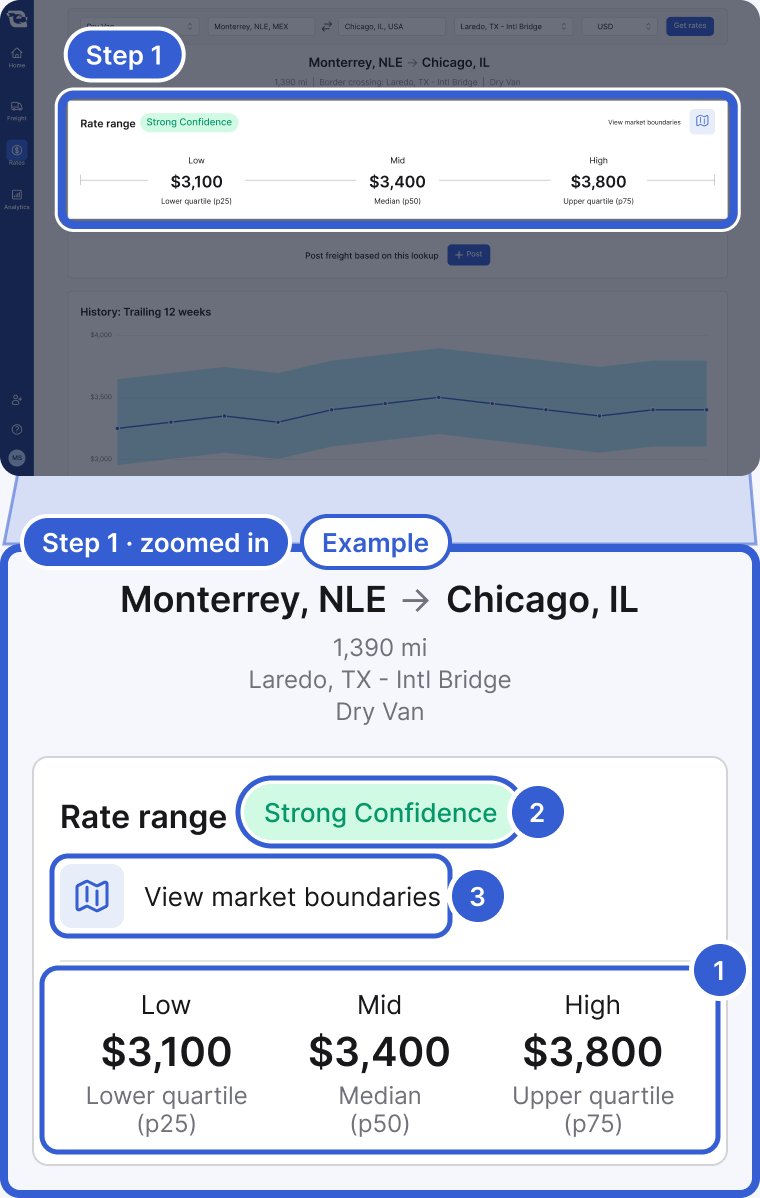
- Low, Mid and High: the 25th, 50th and 75th percentiles of the market data behind the lookup, per load, fuel included.
- The confidence label: hover for an explanation of the margin of error and, when available, its amount and percentage.
- View market boundaries: opens a map of the market areas behind the rate.
Step 2: Check the confidence label
Next to the range you may see Strong Confidence, Medium Confidence or Lower Confidence. The label reflects how much uncertainty there is around the median: how far the true median could sit from the median Cargado shows. Hover the label for an explanation of the margin of error and, when available, its amount and percentage.
Step 3: Read the History chart
The History card plots the Mid (p50) of each point as a line, with the band from Low (p25) to High (p75) around it. Hover a point to see its labeled figures. Use it to see whether the displayed rate has been rising or falling before you quote. The line and the band connect across a point with no data, so a straight stretch can be bridging a gap. The chart appears only when the lookup returns at least four points.
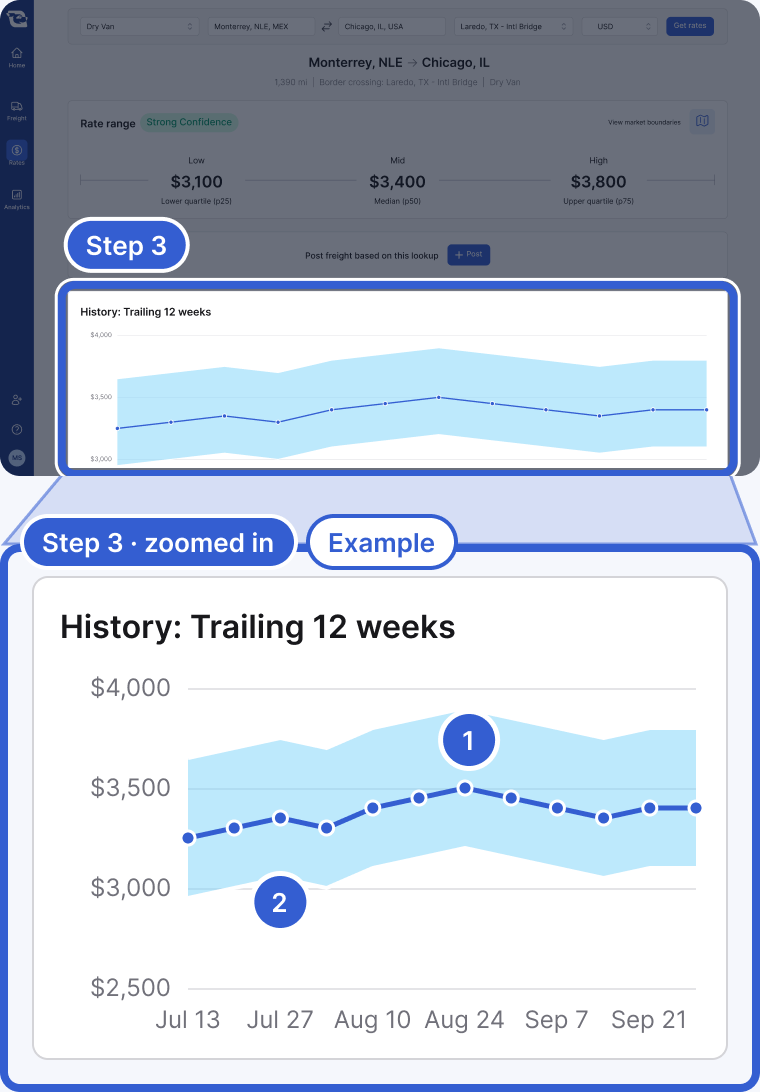
- The line: the Mid (p50) of each point. The app labels it when you hover.
- The band: from Low (p25) to High (p75) at each point, also labeled on hover.
Step 4: Quote with the band
Start near the Mid, and weigh your quote against the confidence label: a wide margin of error means the true market could sit well above or below what you see.
Important: Market Rates is a guide, not a guarantee of what any one carrier will accept.
Extended markets
Some results use an extended market for one or both ends of the lane. Cargado prices each end at its own market when it holds enough rate history there. When it does not, it uses the extended market: that market plus the markets around it. The header then shows the main market of that wider area with (extended market) after it, and the rate is a wider-area reading.
Example: you look up Chihuahua, CHH to Toledo, OH. Toledo has too little rate history on its own, so the destination is priced from the Detroit extended market, which covers Detroit, Lansing, Port Huron, Saginaw and Toledo, and the header reads Detroit, MI (extended market). Click View market boundaries on the Rate range card to see the areas on a map. The confidence label still applies: it describes the uncertainty around the Mid for this lane, so read it the same way as on any other result.
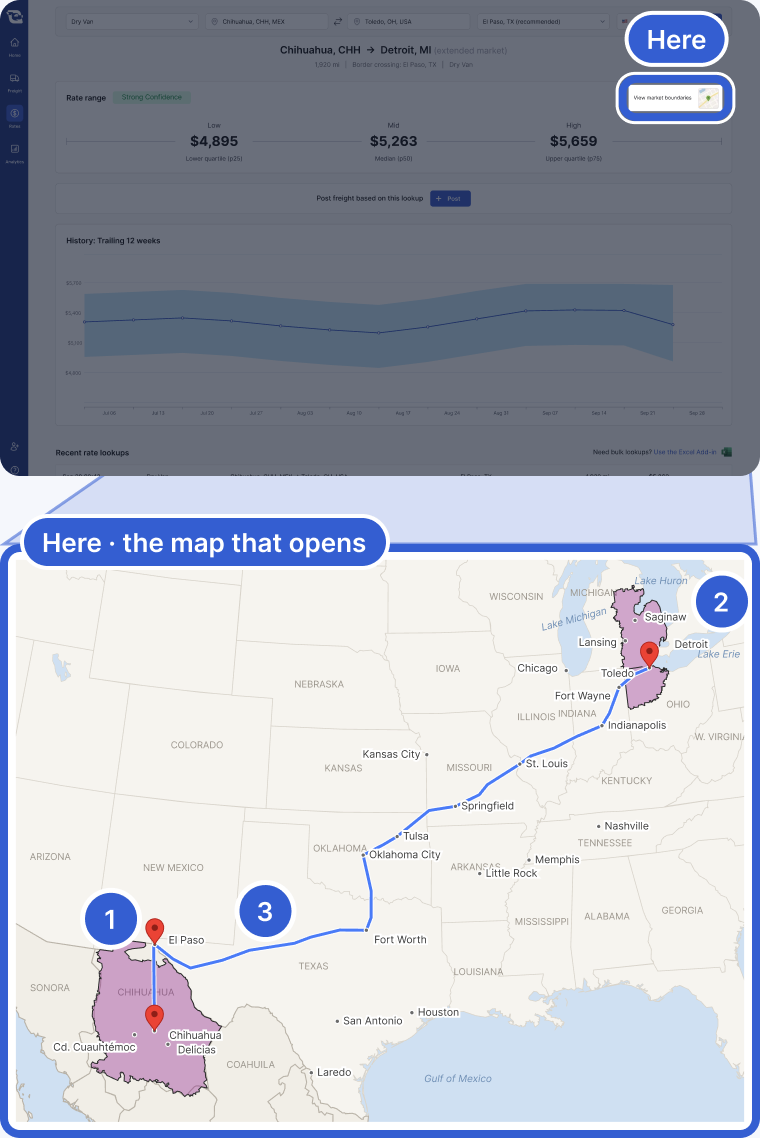
- The origin area: the shaded area around Chihuahua, CHH.
- The destination area: the Detroit extended market, shaded, with Toledo inside it.
- The route between them, through the El Paso, TX crossing.
Good to know
- Currency: you can price a lookup in USD, MXN or CAD. The app can suggest one based on the lane, and you can change it.
- No rate on a lane: when Cargado has no rate to show for a lane, you see We don't have enough data on this lane instead of a guess. See Why is there no market rate for my lane?
Still stuck?
Email us and a person on our team will answer. Send the posting link or a screenshot if you have one.